Lakuwahi Project
JORC Resources Estimate
In January 2012 Robust was pleased to announce the results of the maiden JORC code compliant mineral resource estimate for the Lakuwahi Project on Romang Island, Indonesia.
The resource estimate of 1.18 million gold equivalent 1 ounces is classified within the JORC Indicated and Inferred categories. Base metal resources of 95 million pounds of copper, 697 million pounds of lead and 678 million pounds of zinc are estimated to occur in the sulphide sections of the deposit.
Two-thirds of the gold equivalent ounces are classified as JORC Indicated, with the remaining one-third being classified as JORC Inferred.
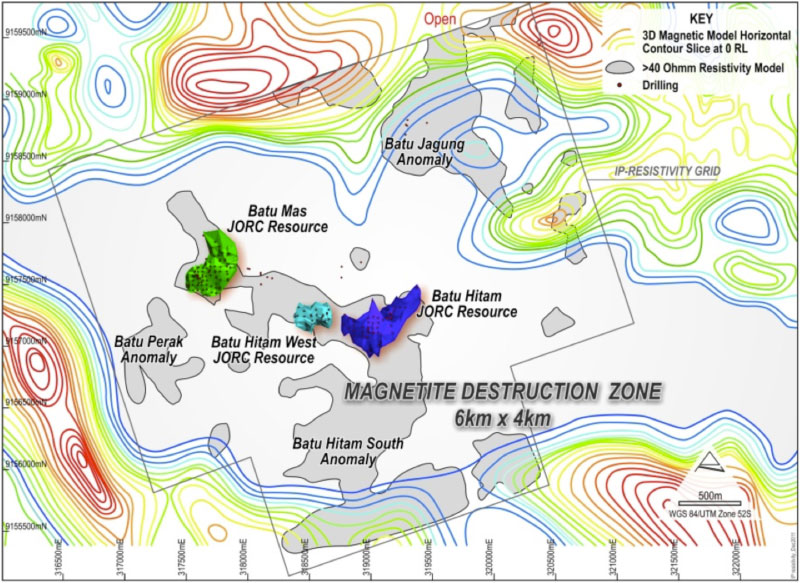
While this JORC resource estimate quantifies significant accumulations of metals, there is strong evidence that this is only the first stage of an even more substantial discovery within the Lakuwahi Project area. Figure 2 shows the wireframes defining the Lakuwahi JORC resource estimate plotted in relation to the highly prospective resistivity anomalies, which lie within the overall Lakuwahi Magnetite Destruction Zone (MDZ) mineralising system.
Excitingly the company has identified numerous opportunities for the expansion of the current JORC resource. These potential opportunities will be realised through extensional drilling at the three known mineral deposits (the Batu Mas, Batu Hitam, and Batu Hitam West prospects) as well as the implementation a new exploration drilling programme designed to test fresh targets.
| Zone | Class | Mass Million Tonnes | Au Equiv (g/t) | Au (g/t) | Ag (g/t) | Cu (%) | Pb (%) | Zn (%) | Au Equiv Thousand Ounces |
Au Thousand Ounces |
Ag Thousand Ounces |
Cu Million Pounds |
Pb Million Pounds |
Zn Million Pounds |
|---|---|---|---|---|---|---|---|---|---|---|---|---|---|---|
| Oxide | Indicated | 6.8 | 1.49 | 0.84 | 30.8 | 328 | 184 | 6,763 | ||||||
| Inferred | 2.8 | 1.26 | 0.54 | 33.9 | 114 | 49 | 3,073 | |||||||
| Total | 9.6 | 1.42 | 0.75 | 31.7 | 442 | 232 | 9,836 | |||||||
| Sulphide | Indicated | 21.6 | 0.67 | 0.36 | 14.3 | 0.11 | 0.68 | 0.76 | 462 | 251 | 9,899 | 54 | 324 | 360 |
| Inferred | 14.1 | 0.61 | 0.24 | 17.5 | 0.13 | 1.20 | 1.03 | 276 | 108 | 7,928 | 41 | 374 | 318 | |
| Total | 35.6 | 0.64 | 0.31 | 15.6 | 0.12 | 0.89 | 0.86 | 738 | 359 | 17,827 | 95 | 697 | 678 | |
| Total | Indicated | 28.4 | 0.86 | 0.48 | 18.2 | 790 | 435 | 16,662 | 54 | 324 | 360 | |||
| Inferred | 16.9 | 0.72 | 0.29 | 20.3 | 390 | 156 | 11,002 | 41 | 374 | 318 | ||||
| Total | 45.3 | 0.81 | 0.41 | 19.0 | 1,180 | 592 | 27,663 | 95 | 697 | 678 |
All figures are rounded to reflect that they are approximate and any apparent summation differences in totals is due to this rounding
The complete resource table from MCS can be accessed here
Notes:
1. Gold (Au) Equivalent = gold assay + (silver assay / 47) where the number 47 represents the ratio where 47 g/t Ag = 1g/t Au.
2. The Lakuwahi JORC Resource was estimated by MCS two ways: a) using no top cuts and b) applied top cuts for Au (12 g/t) and Ag (350 g/t). Please refer to the file that shows the resources both for uncut and top-cut values. Since not many assays are above the top cut values; therefore, the resource totals are very similar. 4. Ag Equivalent (Silver Equivalent) = [(copper assay x copper price x 22.05) + (gold assay x gold price / 31.1) + (silver assay x silver price / 31.1) + (zinc assay x zinc price x 22.05) + (lead assay x lead price x 22.05)] / (silver price x 22.05). The metal prices used in the gold, copper and silver equivalent calculations are the averages of the prices over the 12 months of Financial Year 2011 from July 2010 to June 2011 taken from published World Bank Commodity Price Data (http://econ.worldbank.org).The metal prices thus used in the calculations are the average Gold price of USD $1371.36 per ounce, average Silver price of USD $28.96 per ounce, average Copper price of USD $3.93 per pound, average Lead price of USD $1.09 per pound and average Zinc price of USD $1.02 per pound. Preliminary metallurgical test results previously reported indicate high and broadly equivalent flotation recoveries in sulphide zones for all metals used in the silver equivalent calculations (gold recoveries average 84.3%, silver 93.0%, zinc 97.2%, lead 91.1% and copper 94.6%). Similarly in the oxide zones high and approximately equivalent gold and silver recoveries of 94-95% have been previously reported from early-stage cyanide leach testing. Due to this broad equivalence metallurgical recoveries are not factored into the calculation of silver equivalence.